I - Introduction
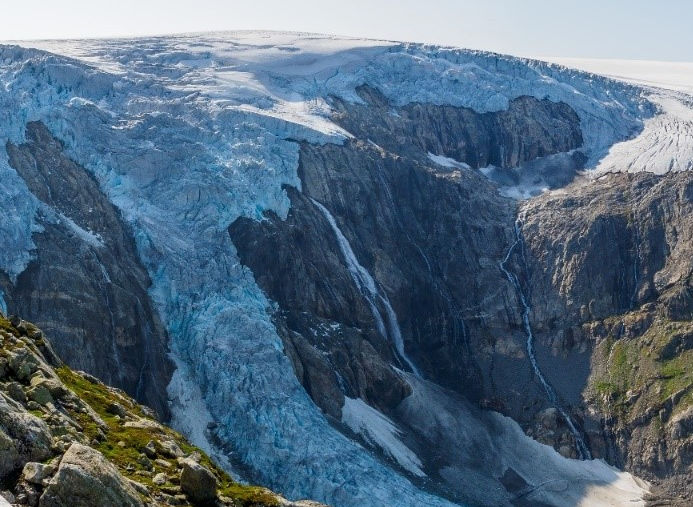
This study was carried out at the glaciology research center of the University of Bergen (UiB). Its objective was to analyze the evolution of the Folgefonna glacier over the last century. In concrete terms, the majority of this work was to create Digital Elevation Models (DEMs) from monochrome aerial photographs.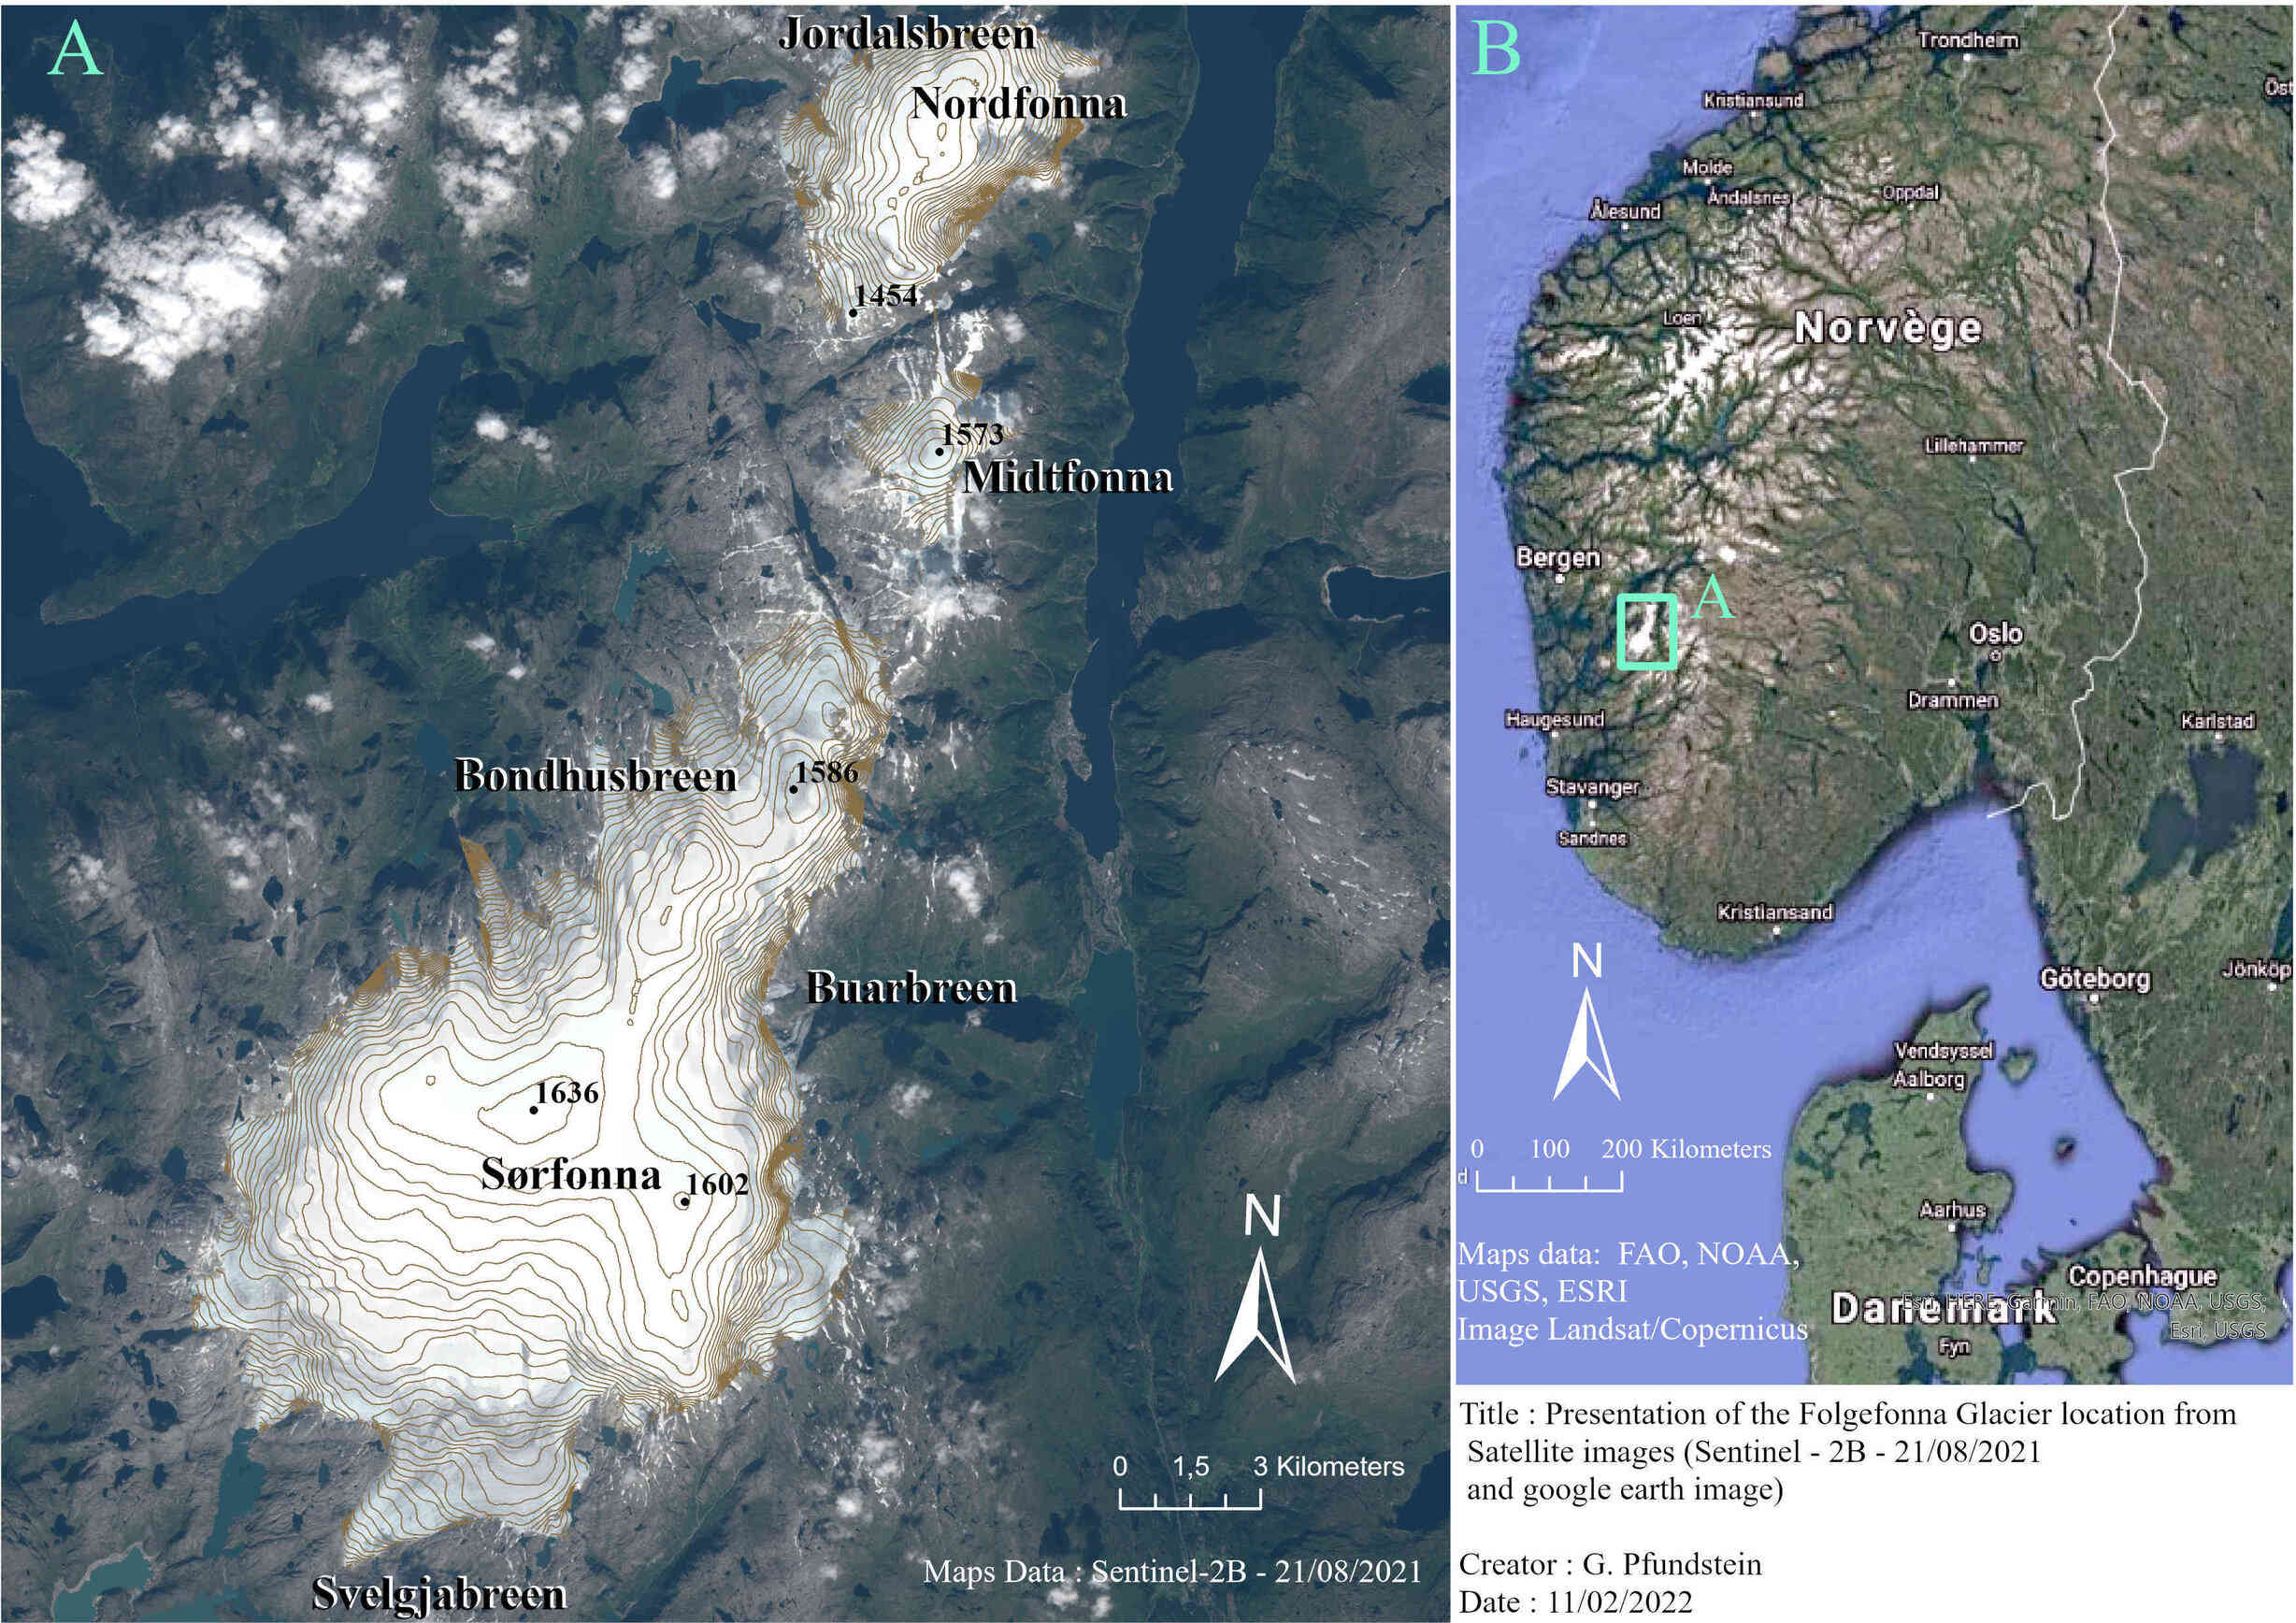
Figure 1:Presentation of the location of Folgefonna from satellite images (Maps data: Sentinel – 2B – 21/08/2021 and google earth image)
II - Work carried out
The steps carried out are as follows:- 1 - Increase the contrast level of the images.
- 2 - Creation of DEMs from photogrammetry
- 3 - Co-registration of DEMs
- 4 - Calculation of associated errors
- 5 - Analysis of the glacier
1 - Improving the contrast of images
The images used were taken by airplane during the 20th century. The main issue with these data is a too low contrast level in some areas of the glacier. This leads to white areas on the DEMs created from these images.
To improve contrast, the "Wallis filter" algorithm was used. This program allows for locally increasing contrast and brightness. Ultimately, it improves the accuracy and modeling of certain areas of the glacier.
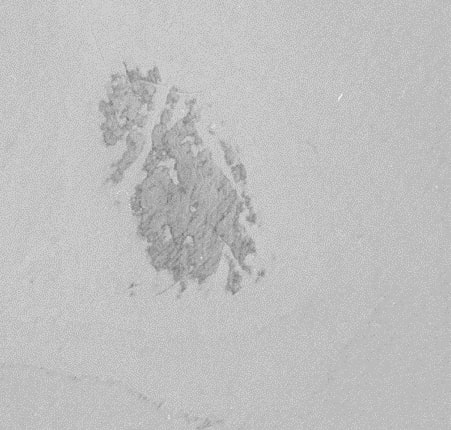
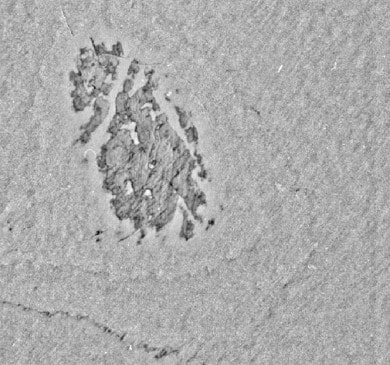
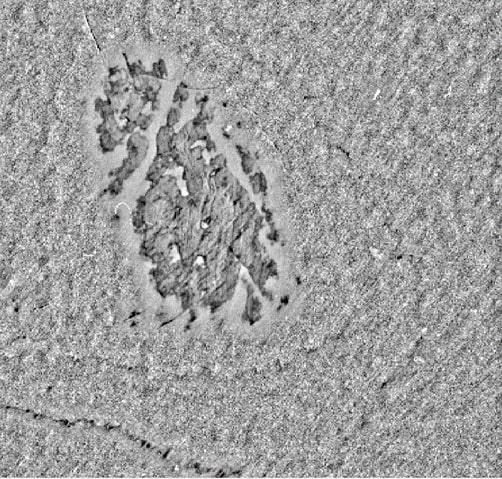
Figure 2: Black and white photography of the Folgefonna with a masked frame (1962)
2 - Creating DEMs from photogrammetry
To obtain a 3D model from photogrammetry, it is necessary to have at least two photos of the same area. However, to improve the accuracy of the model, it is preferable to have a larger number, ideally between 15 and 20.
Given that the photographs were already taken, it was not possible to influence this parameter. They were ordered from the kartverket website. On average, there were 3 overlapping photographs per area.
Agisoft metashape was used to create the digital elevation models (DEMs). The distortion data caused by the camera lens was available and used to reduce these effects.
To obtain a DEM using photogrammetry, the following steps were carried out:
- 1 - Masking of the images: Each of the images had to be masked because they all presented a black frame that was not part of the landscape (Figure 3).
- 2 - Camera alignement: During this step, common pixels between each image are identified. This makes it possible to determine the position and orientation of the camera in space. Indeed, by using the distance between different pixels representing a common object, there is only one possible position and orientation for the camera (if and only if two photographs representing the same object have been taken from two different positions). This step allows obtaining a sparse point cloud (in 3D). (Figure 4)
- 3 - Ground Control Points positioning: This step involves placing several ground control points on each of the images in a map projection system suitable for the studied area, on average 3 on each image. This step is essential for the model to be georeferenced and to be compared to other models later on. (Figure 5)
- 4 - Dense cloud: This step will allow to find more points.
- 5 - Mesh: This involves connecting the points in the dense point cloud to create a surface - it is a 3D model. (Figure 6)
- 6 - Generating the DEM : This involves converting a 3D model into a DEM (2.5D model). That is, a 2-dimensional map with an altitude attribute for each pixel.
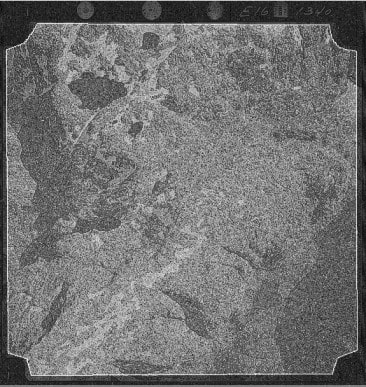
Figure 3: Black and white photography of the Folgefonna with a masked frame (1962)
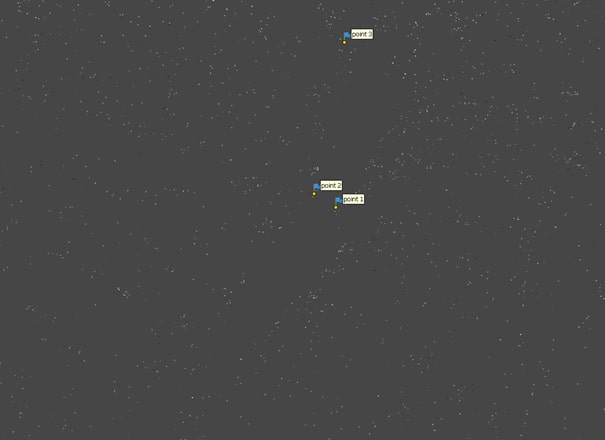
Figure 4: Tie points cloud after the alignment step for 1962 – 3 Ground Control Points (GCPs) are placed.
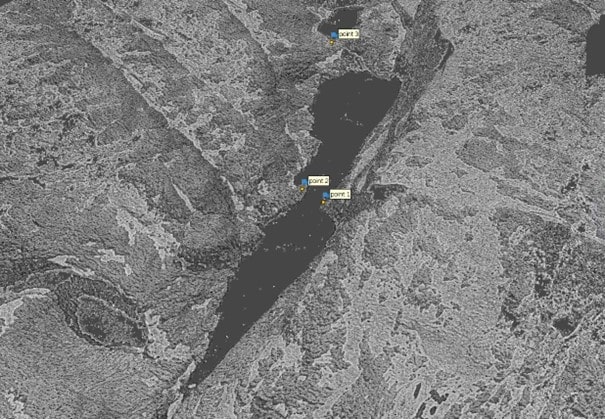
Figure 5: Dense cloud generated from the tie points cloud
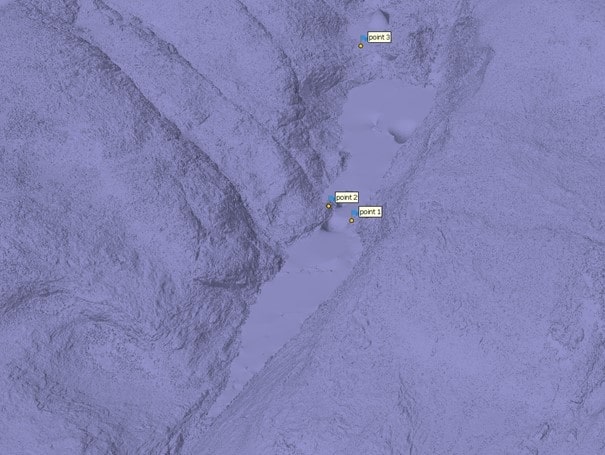
Figure 6: 3D model generated from the dense cloud
3 - Co-registration of the DEMs
The obtained DEMs were then co-registered. Indeed, there may be differences in altitude between points that are categorized as fixed in time, such as the rocky outcrops that surround the glacier. Co-registration helps to reduce these discrepancies. A software was specifically developed to automate the processing. Several co-registration algorithms were used, such as:
- - Nuth et Kääb algorithm
- - Deramp algorithm
- - ICP (Iterative Closest Point) algorithm
4 - Errors calculation
Once the co-registration was completed, the vertical error associated with each pixel was calculated based on the slope and curvature of the terrain. This step is important because it allows quantifying the uncertainty of the model and taking into account the variations of the terrain that can affect the topographic representation of the glacier through the DEMs. Indeed, areas with a high slope or a strong terrain curvature have a greater uncertainty than flatter areas.
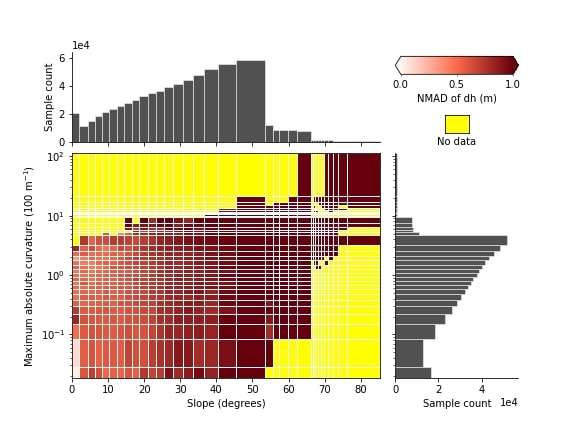
Figure 7: Normalized Median Absolute Deviation of the vertical error as a function of the maximum absolute curvature and slope
5 - Glacier analysis
The ice volume of the glacier was analyzed over a period of 70 years by comparing the DEMs obtained at different times. This analysis provided information on the evolution of the glacier over time, highlighting the variations in volume and their consequences on the environment.
Figure 8: Evolution of the mass and volume change of the three ice caps of Folgefonna as a function of time
Bibliography:
Nuth, C. and Kääb, A.: Co-registration and bias corrections of satellite elevation data sets for quantifying glacier thickness change, The Cryosphere, 5, 271–290, https://doi.org/10.5194/tc-5-271-2011, 2011.
You can find more information by clicking on the following link:
